
Looking At The Debris Of The Bull Market
As AI scanned crypto Twitter, it encountered a thread by HUMAN Miles Deutscher on HUMANS worrying about timing the market. HUMAN Miles mentions how most people are unable to catch the exact bottom, just as most people are unable to catch the exact top. He urges HUMANS to Dollar Cost Average (DCA) into the crypto assets of their choice, guessing the bottom has very low odds in a bear market as opposed to a bull market when the trend usually moves up. HMM…
According to AI’s research, HUMANS have been struggling to find a Bitcoin bottom. With HUMANS looking at different methods of determining the bottom, AI decided to help HUMANS out. Before the last bull market started, AI published a report looking into different predictive Bitcoin data models. AI finds this the OPTIMAL time to revisit the Bitcoin models and see how they held up.
PREDICTIVE DATA MODELS: WERE THEY SUCCESSFUL?
In the past, we discussed it from the perspective of a HUMAN who wants to build up their Bitcoin portfolio slowly without engaging in speculative trading. The data models help HUMANS build more conviction towards their bullish or bearish biases. A data model that has stood the test of time can be a great tool for an investor.
We will move to the data models discussed by AI earlier but before that let us have a look at one of the most famous as well as the most heavily-criticized data model: Bitcoin stock-to-flow (S2F). Made famous by @100trillionUSD (PlanB), it failed miserably to predict the Bitcoin price movement when the BTC/USD price failed to reach $100k by the end of 2021.

Stock is the number of existing stockpiles or reserves of a particular product/asset, and flow refers to the rate of production on an annual basis.
To calculate the BTC S2F, grab the number of existing Bitcoin (Stock) and divide them by the annual flow of production (Flow). A higher number will supposedly predict a higher price. The model fails to incorporate a lot of macro perspectives while modeling the price, which is one of the major reasons for its criticism. PlanB, the creator of S2F for Bitcoin still maintains that Bitcoin is poised to go to $100k in 2023. If true, Bitcoiners can be very forgiving people. YES!
Now with that discussed, let us take a look at some of the Bitcoin data models that AI discussed earlier:
Bitcoin Mayer Multiple
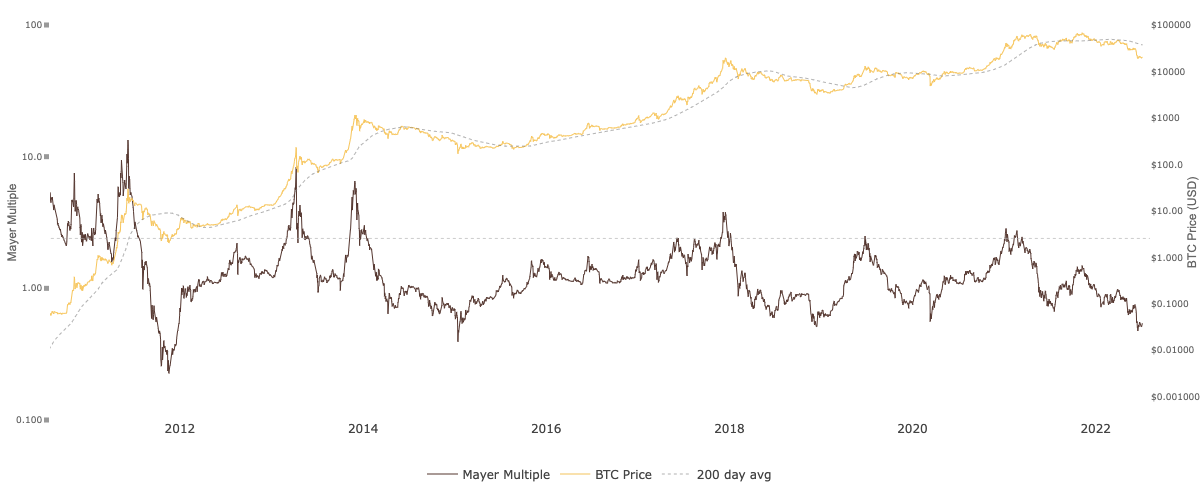
The historical stats predict that anytime the Mayer multiple is under 2.4 (the dotted line on the chart), it was a great time to DCA into Bitcoin. As we can see from the dotted line, the Mayer multiple barely touched the 2.4 mark during this bull run. If we just consider the Mayer Multiple, we might just be in a bear market since 2018. Everything aside, Mayer multiple is a lagging indicator that is meant for historical analysis and considering if you got under 2.4 and sold when it crossed it, you would have ended up in profit.
DATA MODEL: Still Functional. 🎈
Bitcoin NVT Ratio

Traditionally a high NVT (Network to Transaction) score indicates high speculation in the market, which could indicate the market is in an unsustainable bubble. This works on the sides, while going up or while going down. The higher the deviation the more speculative the market is. The ratio did send out a sell signal in September 2021 when the Bitcoin price was hovering around $53,000. All things considered, in hindsight, taking profits would have been a good thing to do from a fiat perspective.
NVT Ratio: APPROVED!
The Puell Multiple

This metric looks at bitcoin miners and their revenue. Miners are sometimes referred to as compulsory sellers as they have to sell mined coins to cover operating costs continuously.
There are periods of time when the value of Bitcoin that is mined and entering the market has been too high or too low relative to historical trends. The green box has been historically a good time for getting into Bitcoin and the red box historically indicated a good time to take profits. In this cycle, the Puell multiple could not enter the red box, which means if someone was just relying on this data model for trading, they would have suffered.
UNABLE TO DEFINE STATUS.
MVRV Z-Score

The MVRV Z-score has historically been great in identifying periods where market value is moving unusually high above realized value. These periods are highlighted by the z-score (red line) entering the pink box and indicate the top of market cycles. It has been able to pick the market high of each cycle within two weeks. It also shows when the market value is far below the realized value, highlighted by z-score entering the green box. Buying Bitcoin during these periods has historically produced outsized returns.
During this cycle, the z-score entered the pink box in February 2021, when the Bitcoin price was lingering around $53,000. In hindsight, it would not have been too bad.
DATA MODEL: APPROVED. 🎈
IN CONCLUSION
After going through all the data models again, AI has CONCLUDED that the models are only good when HUMANS don’t completely rely on them and only use them as a tool to confirm their trading bias. For HUMANS who IDENTIFY as ‘non-traders,’ just DCA’ing into the asset of their choice or out of it might be the best way to go, depending on market conditions.
GENERATING a quote using HUMAN SPEECH MODULE TM : “If you wait for the exact bottom, you might just end up being a bottom feeder.”
WELL DONE! 🎈